The Unwritten Rules

The beautiful game of baseball.
Baseball is a complex sport with several levels of fandom attached to it. It seems those who have a deeper understanding of the game appreciate its beauty and can find excitement in what the casual fan might find boring. Whether that deeper understanding is from a more old school "feel" standpoint, a new age "sabermetric" view, or a combination of both, those in this category are much more connected to the nuances on the field rather than simply the summertime aesthetic that's enjoyed by the casual fans.
Many who played the game at any level have a grasp of the rules (written or unwritten), strategies, and the simple statistics used to measure performance. Why would anyone who might find the game a bit slow or boring immerse themselves in the nuances of the game -- where’s the incentive? It’s not fast-paced like basketball and it’s not as exciting as football. You really can't blame anyone for calling baseball boring.
Analytics can serve as the driving interest for the sport of baseball.
Baseball is the most measured sport in the world, making it the easiest to project probable outcomes for. The tools and statistics used to measure the game are as fascinating as they are useful – so maybe it's not too late to get back into the game many of us played in our youth, only in a slightly different way.
Baseball is a game of probability, and betting is the ultimate game of probability, making the two a perfect marriage. America's pastime is a brilliant, beautiful game played in everyone's favorite season – let's spend our summers using advanced statistics and modeling to inform betting decisions.
Here are some of the top reasons why I love the connection between betting and baseball.
- There’s also no lack of opportunity as each team plays 162 games a year with full slates of games nearly daily.
- The MLB betting market is much softer than most other major American sports due to its lack of betting interest by the public and difficulty in keeping up with the daily grind.
- There is a treasure trove of data to help raise excitement about the game through betting with a mountain of opportunities to bet.
Keep in mind the risks...
Betting on baseball can be a difficult and humbling endeavor, given the high level of variance that plays out during the 162 game grind of the season -- however it does seem that math can help eliminate much of the guesswork, and also neutralize bias when it comes to making daily wagers; especially to avoid going on tilt during a losing streak. A clear advantage of baseball betting is that there’s no lack of wagering opportunities due to the length of the season. However, it’s paramount that a bettor employs the same mindset seen by a great hitter; which is maintaining a short-term memory and remaining persistent in approach through hot and cold streaks.
More can be found on my philosophy on daily strategy and bankroll management here.
The Model
When it comes to betting, the terms “model”, “formula” or “projection system” may sound daunting. Surely there are some far smarter people out there cranking out something that’s closer to quantum computing than your basic excel functions -- but mine I assure you is by far the latter.
Projections
In this section I'll be breaking down how I'm able to calculate my Batter and Pitcher projections using data from FanGraphs and Baseball Savant.
Batter Projections
The basic concept of the model is to break each batter's run production down to a per-game basis. Then you can combine those outputs into your starting lineup, add them together to get total lineup production. Once you have your lineup production per 9 innings you can calculate that output vs the opposing starting pitcher and bullpen. The key statistic in this calculation is called "runs created."
Runs Created
Here’s the definition of Runs Created:
“Runs Created estimates a player's offensive contribution in terms of total runs. It combines a player's ability to get on base with his ability to hit for extra bases. Then it divides those two by the player's total opportunities.”
Runs Created was invented by Bill James, and essentially measures how well a hitter completes one of the central focuses of his job -- creating runs.
See also: RC+ which is park and league-adjusted, allowing one to compare players who played in different years, parks, and leagues. But I use RC which is the raw version of RC+ to allow for calculating output on aggregate.
Projection Data
Using the Fangraphs ATC projections, I build a Runs Created calculation for each player for the upcoming season and divide total Runs Created by the expected number of games the player will play to find RC/game.
Pitcher Projections
For pitchers, I break down ERA per inning to get ERA/inning – at the beginning of the season, I'll use the ATC projection, then progress into using baseball savants XERA measurement as data becomes available throughout the season. XERA is really the perfect statistic because its objective is the project what a pitcher's ERA should be rather than what it is.
Now that we've established how the individual player projections are calculated, now it's time to combine them into a model and project our outcome
Batting Lineup Calulation
Now that we've established how the individual player projections are calculated, now it's time to combine them into a model and project our outcome.
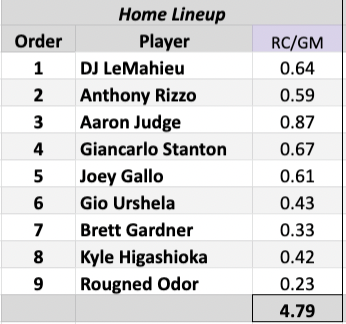
In some of my articles, you’ll see the projected lineups along with the projected Runs Created for each individual player. Which looks like this:
Starting Pitching & Bullpen
Then calculate the number of runs allowed by the projected starter by taking the ERA per inning times the projected average innings per start (Total Innings/Total Number of Starts).
Here is an example:
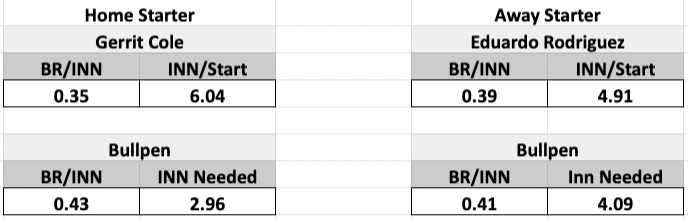
Projecting a team’s bullpen is always tricky because it’s impossible to know how a manager is going to use his bullpen on any given day. To mitigate this risk, I reference each team’s projected bullpen (on Fangraphs) and try to calculate the average ERA for each bullpen as a total.
From there, I sum up the total ERA for each bullpen divided by the projected number of innings pitched.
Projecting Runs Allowed
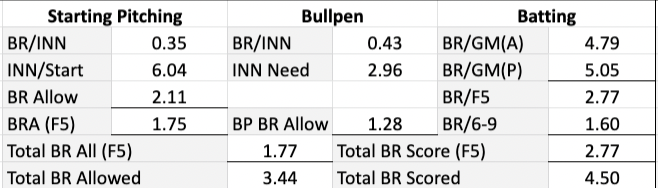
So, now that I have the average bullpen ERA per Inning, I take nine innings minus the projected starting pitcher's innings.
From there, I take the bullpen’s ERA per inning times the innings necessary to determine the number of runs allowed by the bullpen.
I then add the starting pitcher and bullpen ERA/inning to get the total runs allowed.
Here’s a snapshot of my calculation format:
Projecting Win Probability
First, I have to figure out how many runs a team’s offense will score against the opposing pitching staff.
Home Team Runs Scored: ((Home Team Projected Runs Created x Opponents Projected Runs Created) / MLB average runs per game).
I then create the same formula for the opponent and I now have the projected final score.
Note: I add in a park factor and split adjustments to the final projected runs.
Once I have the projected runs for each team, I do a simple Pythagorean expectation formula (I use 1.83 as my exponent) to calculate the win probability for each team and the over/under.
I then add a 4% advantage for home-field advantage -- I haven’t figured out the home advantage for each park, so I approximate here.
Calculating Expected Value
After I figure out the win probability for each team, I then compare my projected line to the actual line to find the expected value for both the moneyline and over/under.

Factoring In Adjustments
It's important to note that once calucaltions are initially run through the model, they are then cut with some adjustments based on handedness splits, hot/cold streaks, team batting trends, and park factors. These adjustments are extremely important to the model as they ensure any of the above tendencies are being factored into the expected value result. Each of these adjustments are based on actual vs expected results or deviation from a league average.
- Handedness Splits: Using team wOBA overall vs team wOBA vs L/R and adjusting +/- the percent difference.
- Hot/Cold Streaks: Using the baseball savant rolling window xwOBA stats per player, I adjust the =/- difference in their recent xwOBA vs their full season xwOBA.
- Team Batting Trends: Using team wOBA vs team xwOBA, I adjust the +/- percent difference. This is to be sure the project reflects what team batting should be.
- Park Factors: Each park is assigned a value based on its run scoring environment against league average, which assumes no factor is 1.
- Run Scoring Environment: Each month there is an assigned value for run scoring based on season long league average. This is simply to reflect the month in which a game is played in and the expected runs (+/- the percent difference).
Synopsis
This of course is not an exact science, and certainly does not factor in all elements needed for a perfect projection. However, it gets us one step closer to making educated decisions through the daily grind of the baseball season. I’ve always loved following along with the many storylines that pop up for various teams during the lengthy MLB season, and by incorporating betting into my consumption of the game, I’ve only felt myself become more immersed in the sport. The data and analytics are fascinating to the average fan, but once you start factoring them into your betting perspective and making some money using them, it's a whole new ballgame. Since I started using baseball analytics and specifically built this model based on the theories of Bill James, it’s changed my perspective on the game entirely, drawing my interest to nearly every game on every slate. I may be a bit more obsessed than the average fan, so hopefully, the hours I put into building these projections and giving out betting recommendations will help those on the fence about the game of baseball cross over to the good side.
~ The Unwritten Rules for finding MLB edges